Eschikon Plant Stress Phenotyping Dataset

Overview
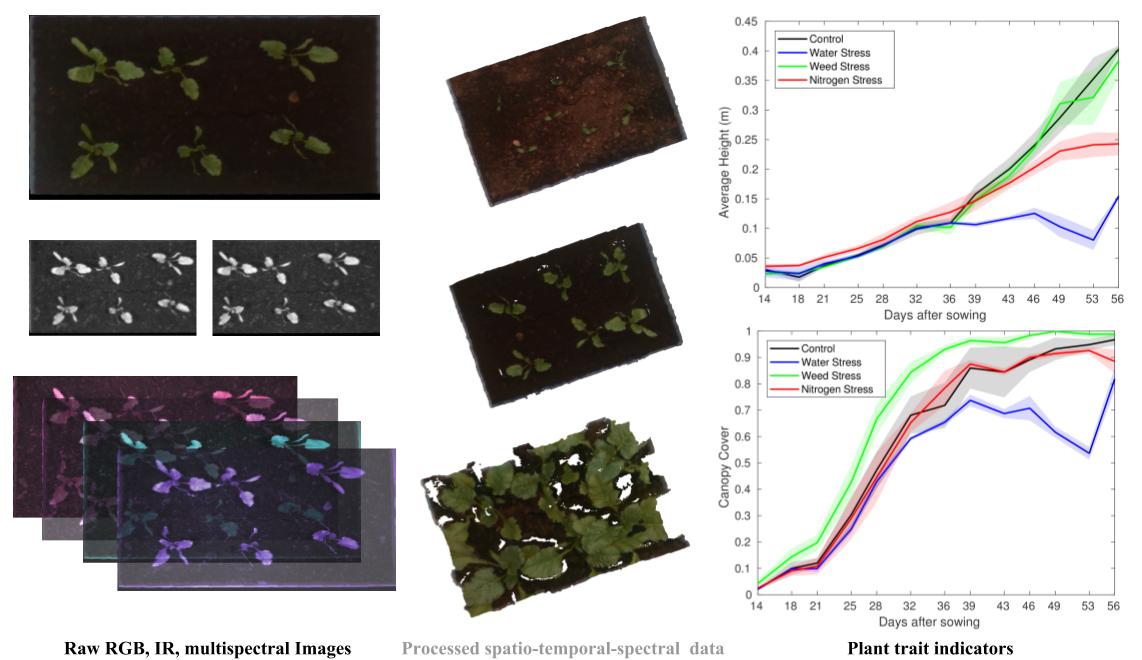
We present a dataset with spatio-temporal-spectral data pertaining to sugarbeet crop growth under no, drought, fertiliser and weed stress conditions over two months. The dataset contains biweekly color images, infra-red stereo image pairs and multispectral camera images along with applied treatment parameters and temperature and humidity of the surroundings. If you find this dataset useful, please cite the following work
A Spatio Temporal Spectral Dataset for Plant Stress Phenotyping by Khanna, Raghav and Schmidt, Lukas and Nieto, Juan and Siegwart, Roland and Liebisch, Frank
Treatments at a Glance
| Description | # of Boxes | Soil Type | Water input | Nitrogen Input | Weed Pressure | Box Numbers |
|---|---|---|---|---|---|---|
| Control | 3 | 2 | Sufficient | High | None | 1,2,3 |
| Low N | 3 | 1 | Sufficient | Low | None | 22,23,24 |
| Med N | 3 | 2 | Sufficient | Medium | None | 4,5,6 |
| Med weeds | 3 | 2 | Sufficient | High | Medium | 7,8,9 |
| High weeds | 3 | 2 | Sufficient | High | High | 10,11,12 |
| Dry | 3 | 2 | Low | Medium | None | 13,14,15 |
| Weed Only Dicot | 1 | 2 | Sufficient | High | High | 16 |
| Weed Only Monocot | 1 | 2 | Sufficient | High | High | 17 |
| Weed Only Mixed | 1 | 2 | Sufficient | High | High | 18 |
| Low N - Med Weed | 3 | 1 | Sufficient | Low | Medium | 25,26,27 |
| Drying - Med N - High Weed | 3 | 2 | Low | Medium | High | 19,20,21 |
| Drying - Low N | 3 | 1 | Low | Low | None | 28,29,30 |
| CALTag and Color Checker | 1 | 1 | NA | NA | NA | 31 |
Download
The entire dataset may be found here.
Software providing common useful pre and post processing routines can be found in the accompanying github repository.
The dataset consists of the following data. The folder structure is as follows, folder and file names should be indicative of the data they contain.
The images.zip (2.5GB) archive contains the raw image data. Images are organised by their measurement date and further by the camera (rgb/infra-red/multispectral)used.
The pointclouds.zip (2.5GB) archive contains the processed spectral point cloud data in .mat format. Point Clouds are indexed chronologically. Please refer to the MeasurementPointCloud class in the accompanying software for a detailed description of the data structure.
Geometric calibration images (containing a checkerboard) can be found in the calibration.zip archive.
The temperature and humidity logs from the greenhouse can be found in the greenhouse-temperature-humidity-logs.csv file.
The biweekly measurements of box weights present in the box-weights-kg.csv file can be used to estimate the soil moisture content at that time.
SPAD measurements can be found in the spad-measurements.csv file.
Weights in grams of both above and below ground biomass for each box which serve as yield indicators may be found in the yield-weight-grams.csv file.
